APA Tables in R
Generating decent tables in R is something I have struggled with for some time, particularly when these need to follow APA guidelines. SPSS has proved to be a complete nightmare so in the past I've simply built templates in Word and copied the numbers across manually from the R console.
This is both time-consuming and increases the chances of human error.
Fortunately, David Stanley has written a great library that can quickly generate results and place them in APA tables.
One note of caution - your data frame must be complete (i.e. no missing values) and only include variables you want to appear in the table. Subsetting your main data frame beforehand may be required in the first instance. Otherwise, it is plain sailing:
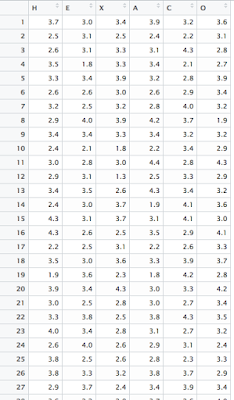
For example, a data-set with six personality factors calculated from the HEXACO personality inventory across several hundred participants might look like this...
To generate an APA correlation table run the following:
##load library
library("apaTables")
##load data frame
data <- file="data.csv" font="" header="TURE," read.csv="" sep=",">
##Creates a correlation table in APA style with means and standard deviations
apa.cor.table(data, filename = "correlation.doc", table.number = 1,
show.conf.interval = FALSE, landscape = TRUE)
data - name of data frame
apa.1way.table(iv, dv, data, filename = NA, table.number = NA,
show.conf.interval = FALSE, landscape = FALSE)
Creates a table of means and standard deviations for a 2-way ANOVA design in APA style
apa.2way.table(iv1, iv2, dv, data, filename = NA, table.number = NA,
show.conf.interval = FALSE, show.marginal.means = FALSE, landscape = FALSE)
Creates a d-values for all paired comparisons in APA style
apa.d.table(iv, dv, data, filename = NA, table.number = NA,
show.conf.interval = TRUE, landscape = TRUE)
Creates a regression table in APA style
apa.reg.table(..., filename = NA, table.number = NA)
... - the regression model has to be entered here.
The full manual is worth consulting as it provides several more advanced examples on page 6.
This is both time-consuming and increases the chances of human error.
Fortunately, David Stanley has written a great library that can quickly generate results and place them in APA tables.
For example, a data-set with six personality factors calculated from the HEXACO personality inventory across several hundred participants might look like this...
To generate an APA correlation table run the following:
##load library
library("apaTables")
##load data frame
data <- file="data.csv" font="" header="TURE," read.csv="" sep=",">
##Creates a correlation table in APA style with means and standard deviations
apa.cor.table(data, filename = "correlation.doc", table.number = 1,
show.conf.interval = FALSE, landscape = TRUE)
data - name of data frame
filename - this is optional, but required to save the table as .doc or .rtf to your working directory
table.number - any integer
show.confidence.interval - self explanatory
landscape - FALSE for portrait
This generates a word document:
The code can also be subtly modified to produce other tables:
Creates a table of means and standard deviations for a 1-way ANOVA design in APA style
apa.1way.table(iv, dv, data, filename = NA, table.number = NA,
show.conf.interval = FALSE, landscape = FALSE)
Creates a table of means and standard deviations for a 2-way ANOVA design in APA style
apa.2way.table(iv1, iv2, dv, data, filename = NA, table.number = NA,
show.conf.interval = FALSE, show.marginal.means = FALSE, landscape = FALSE)
Creates a d-values for all paired comparisons in APA style
apa.d.table(iv, dv, data, filename = NA, table.number = NA,
show.conf.interval = TRUE, landscape = TRUE)
Creates a regression table in APA style
apa.reg.table(..., filename = NA, table.number = NA)
... - the regression model has to be entered here.
The full manual is worth consulting as it provides several more advanced examples on page 6.


Comments
Post a Comment