Posts

Showing posts from 2012

Why are we still paying for statistical software?

' What programme should I use to analyse this data? ' About ten  years ago there was little choice and expensive software would have arrived in a box containing a CD-ROM! I still have SPSS and MATLAB in my applications folder. They don't come on CDs anymore, but from a central university server. Like CDs however, these programmes are on the verge of becoming a redundant medium.  Given the choice of free tools available today, how are commercial alternatives going to survive?  IBM acquired SPSS a few years back  for $1.2 billion, which I am not convinced was a particularly smart move.  Psychologists typically want to test  predictions,  visualise data and produce models. That said, additional functionality can often be required quickly and unexpectedly as a research project or idea develops. An open-source community allows for flexibility that paid alternatives do not offer (yet). The basic SPSS package has barely changed in the last decade, which is a long

At the pub with a time series

Image
When following the variation of some quantity over time, it is termed a time series.  For example , when plotting the number of births per month in New York city from 1946-1960, there is a peak each summer (seasonability). There is also long-term growth in the number of births each year (a trend). The pilot data below comes from an accelerometer showing the amount of movement produced by an individual over time. This sensor is worn around the neck and produces a data point every second. To keep things interesting, I should mention that the individual wearing this sensor was at the pub for around 2 hours and while there consumed 2 units of alcohol. The rapid spike at the start shows them walking down the stairs to the bar (conveniently located below the School of Psychology). Due to the large number of data points and variation within the data, it is almost impossible to get an idea of what is going on as the evening progresses (if anything!). Although we might predict tha

Q:Google's biggest problem today? A:Non-existent Customer Service

Image
Despite the recent unveiling of the new iPad mini , I would maintain that  Google's Nexus 7 tablet represents superior value for money. Granted it weighs a little more and lacks a front camera, but it's over £100 cheaper and that includes a quad-core processor! But there lies a fatal flaw. While the likes of Apple and Amazon have customer service down to a fine art, Google appears to be living on another planet.  Imagine an Amazon order that arrived broken, faulty or late. In almost every case, they would immediately despatch a replacement or issue a refund. Problem solved. My recent experience with Google has taken over a month to reach a similar conclusion. Part 1: The Order* I placed an order for a Google Nexus 7 Tablet on the 18th of September. Money was taken from my account and my tablet dispatched with an accompanying TNT tracking number. Unfortunately, this tracking number was invalid. After several days I phoned Google customer service to make some enquires.

Kernel Density Plots: Has the histogram had its day?

Image
Simple statistical concepts include the mean, median, standard deviation, and percentiles. These are useful for summarising data. Except these summary statistics are only useful under certain circumstances. When basic assumptions are not met, then any conclusions based on simple summary statistics are likely to be inaccurate. Unable to give a hint as to what is wrong, the numbers can often look perfectly reasonable. Lets consider a sample of 64 reaction time observations (in milliseconds): Mean = 387ms Median = 340ms These look ok, until you view the distribution, which is not unimodal.  Despite being a staple in data visualisation, histograms can often be a poor method for determining the shape of a given distribution because they are strongly affected by the number of bins used. For example, visualising the same data with only four bins can make the same observations appear normally distributed. Similarly, a box-plot can also hide data irregularities and, like histogram

The Hexaco Personality Inventory - SPSS Script

I am currently using the 60-item version of the Hexaco-PI-R personality inventory and decided to write a short script for SPSS to help speed up the coding process. I have posted it below because I couldn't find anyone else who had posted one online. All items should be labeled as separate numeric variables as hexaco1, hexaco2, hexaco3 ...etc The script computes and prints the results for all reverse scored items and then calculates and prints Factor/ Facet scores. It will also produce Cronbach's Alpha coefficients for each factor. The original scoring key for the HEXACO-PI-R can be found here . ******************************************* *Part 1 - reverse scoring of specific items *Honesty-Humility COMPUTE rhexaco30 = 6 - hexaco30. EXECUTE. COMPUTE rhexaco12 = 6 - hexaco12. EXECUTE. COMPUTE rhexaco60 = 6 - hexaco60. EXECUTE. COMPUTE rhexaco42 = 6 - hexaco42. EXECUTE. COMPUTE rhexaco24 = 6 - hexaco24. EXECUTE. COMPUTE rhexaco48 = 6 - hexaco48. EXECU

Network analysis: Where are you in my social network?

Image
Michael Slater-Townshend  talks extensively about the merits of understanding your own and other online communities in this in this months Royal Statistical Society magazine. After following his advice, I have discovered that it is surprisingly easy to download your own Facebook data and see which of your friends form connected groups. Several apps allow you to download 'raw' Facebook data in a format that suits almost any statistical package. I used NameGenWeb . The resulting file can then be imported into a variety of statistical packages. I chose to use Gelphi  for this example. My unprocessed Facebook network looks like this... Each dot (or node) is a friend and the lines show friendship connections between each individual.  In order to make things manageable, I ran a cluster analysis to look for groups of people who are more connected to each other. This quickly produced three distinct groups. The larger circles represent clusters of 3 or more people who share

Do expensive HDMI cables matter?

Image
Having been on the hunt for a new CD player (yes some people still listen to CDs!), I did the usual browse of hi-fi magazines and websites to help guide me towards what might be an improvement over my 18 year old Rotel . That said, it is becoming increasingly difficult to trust any review when some magazines describe a £300 HDMI cable as sounding ' controlled and composed '. This is a cable that carries a digital signal - digital meaning 1's and 0's. By that logic, a more expensive ethernet cable linking your personal computer to a network should also result in a more ' controlled and composed ' internet experience. It won't. In the digital domain, the correct information is either received or it isn't. I have been unable to find any scientific evidence suggesting that a difference in picture quality can be detected between an HDMI cable costing £20 or £200. What I have found is a lot of anecdotal evidence from people who have invested in these

Health and Safety: It's a funny old game.

Image
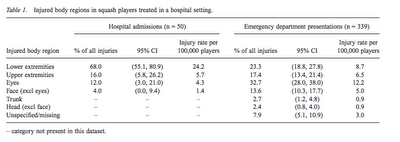
I recently attempted to take some exercise at my local gym and failed miserably. Not through injury or lack of motivation, but simply because I have not yet completed a gym induction programme. Prevented from using the treadmill, I was instead allowed to go for a swim (without any armbands)! The previous day I was also permitted to play squash in the same sports centre without any induction. So what carries more risk - squash or a treadmill? A quick literature search found one paper* that looked at hospital admissions relating to squash injuries in Victoria, Australia between 2000 and 2001. The authors found an overall injury rate of 35.5 injured players per 100,000. Over 90% of these patients were not admitted to the hospital and were discharged the same day. As for running on a treadmill, I couldn't find any meaningful numbers relating to hospital admissions based on running inside or outside. Using some common sense, running inside is likely to be safer than running

Squash and Statistics - Together at Last!

Image
Wimbledon, Euro 2012, The Olympics. The Great British summer of sport has already arrived, but I am sad to say that my sport of choice will not be represented in any of these events. I can't do anything about that, but what I can do is attempt to see where my own game could use some improvement. I regularly play games against my friend Josh (@bain_josh) and most of the time, these games are pretty close. My own gut feeling is that when I win a match, I am overreliant on gaining points when serving. When Josh wins, this doesn't seem to happen. I should add at this stage that you  do not  need to hold serve to score a point in squash. Points are awarded based on who wins a rally. The winner of that rally then goes onto start the next and so on. Basically, I think amongst the many things we could both improve on, one of those is our return of serve. After filming two games - I set out to try and answer how important this might be in deciding the final score. Ideally, I would h

How many Tweets does it take to make a thesis?

Image
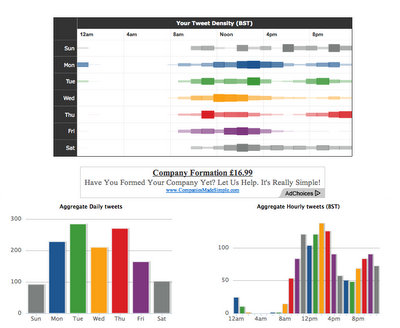
Most of my life at the moment consists of writing my thesis, which is fine. I am quite envious of people who can focus on one task for hours on end, but that is rarely me so my writing tends to be quite sporadic. I frequently jump between chapters and keep telling myself that this allows me to get a better feeling for the thesis as a whole. All other written output has suffered, but it won't be forever. I am still semi-engaged with that thing that has become an escape route for batches of 140 characters that are unlikely to ever become something more meaningful. Twitter. But how far would all my Tweets get me in terms of a thesis?   I have produced 1,350 Tweets over the last 2 years. Assuming they were all 140 characters long, this would equate to 1350*140 = 189,000 characters. Lets say the average word length is around 5 characters so 189000/5 = 37,800 words. Not bad. To find out a bit more about your own tweets, try  tweetstats.com . Unfortunately, there are seve

Exam dates published = unproductive behaviour change

When studying for exams, I was given three bits of advice: (1) Get plenty of sleep (2) Exercise (3) Eat plenty of fruit and veg. This advice should seem fairly obvious. All of the above has been shown time and time again to to maximize cognitive function. Yet what actually happens is the complete opposite - even amongst psychology students who should know better! The library has begun to fill with a large number of people who spend all day everyday glued to their books. The gym has emptied. Healthy food is usually off the menu. I have a theory, which remains totally untested! As an exam gets closer, anxiety levels rise accordingly. For many, this anxiety will increase when they remove themselves from their standard studying environment. This becomes a reinforcer and as studying becomes habitual, little time is made for anything else. Once the deadline or exam passes, life returns to normal. This may apply to other stressful deadlines throughout life, which often cause a

Being honest with statistics

Image
Daniel Bor's latest blog entry  discusses problems with weak statistics in neuroimaging papers, but the issues raised are relevant to any area of research that relies on inferential statistics. For example, as behavioural scientists move towards collecting larger data sets, the risk of finding false-positives increases accordingly. Statistics also play an important role in any psychology degree. Gaps in statistical knowledge quickly become apparent when students are asked to critically review other's work or carry out their own research. One wonders if these early misconceptions could contribute to poor research practices further down the line.  In my somewhat limited experience, psychology students generally know what numbers they need to report, but often fail to understand what goes into making those numbers a reality. This common misunderstanding can be split into three distinctive areas where undergraduates may benefit from additional support: (a) Any introductory stati

What does it mean to be digitally literate in 2012?

Out of 28,000 teachers who qualified in 2010, just three individuals had a computer-related degree . This makes me wonder just how tech-savvy a lot of 10 to 15 year olds really are. When I was 10 in 1996, my parents purchased our first ever home computer. It had the latest Intel Pentium processor that clocked in at a whopping 120Mhz. To put that in perspective, most iPhones today run at ten times this speed.  Things were tricky at first. Windows 95 took awhile to get used to and most video game developers still preferred MS-DOS as a platform because it provided a more stable environment. Direct X was in its infancy and the Xbox was over a decade away. Microsoft's idea of Plug and Play technology rarely applied and/or worked.  Fifa 96 was a Christmas present that year, but due to MS-DOS being unable to correctly identify the computers CD-ROM drive or sound card, I didn't get to play it until February 1997.  When attempting to run the game, instead of giving me